Any user creating and/or running reports must have the proper authority to view and read the data that they are querying or listing. A user’s Roles, Permissions and Organizational Structure (RPO) determine the scope of data available to them for reporting.
The Report Wizard provides the user the capability to list and query data for use in a report or a Custom Form. Custom Forms can be used to access or add data to the GAL database, activate plans and export data outside of the system.
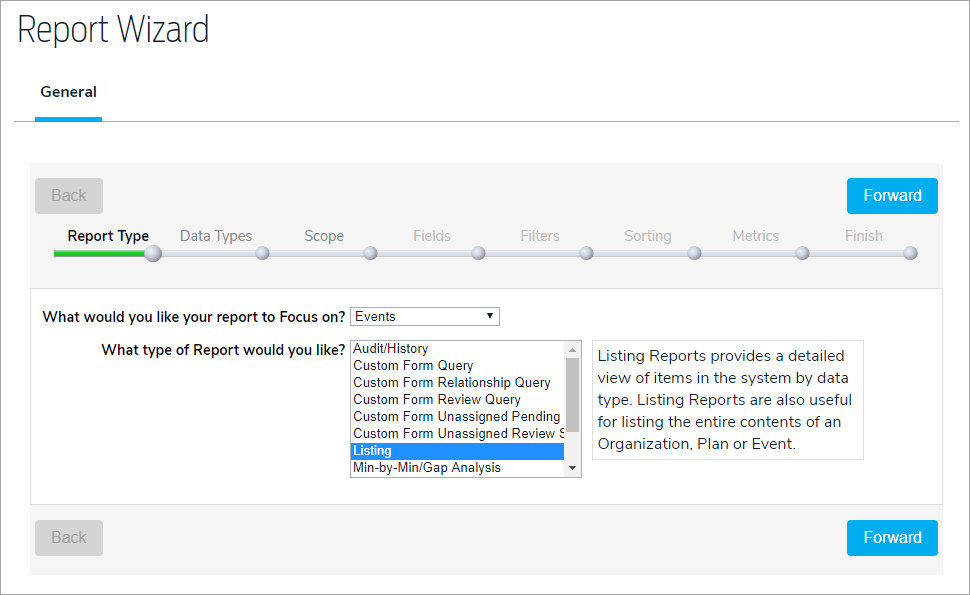
Report Type
In this example, the user wants a report for the events that they have the authority to view. There are other types of reports available, which ones are available depend upon the focus of your report/query. For an explanation of each type of report, move your mouse over each one and read the accompanying help text. Clicking the button takes the user to the next section in building their report/query.
Data Types
Depending upon the data object (focus) of the report/query, different data types can also be included in the report. Since the focus of this report is events, the user can include other GAL data objects that are part of the event. Simply, check the box for the other types of data that you want.
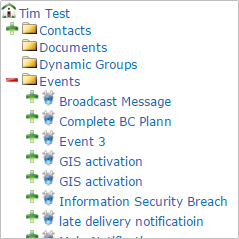
What is the scope of your report/query? Do you want to look at all the events you have the authority to view or do you want to include/exclude events for an entire organization in your hierarchy, a certain plan, a specific event? The scope of your report determines how much data you are selecting. Here, I have selected three events for my report.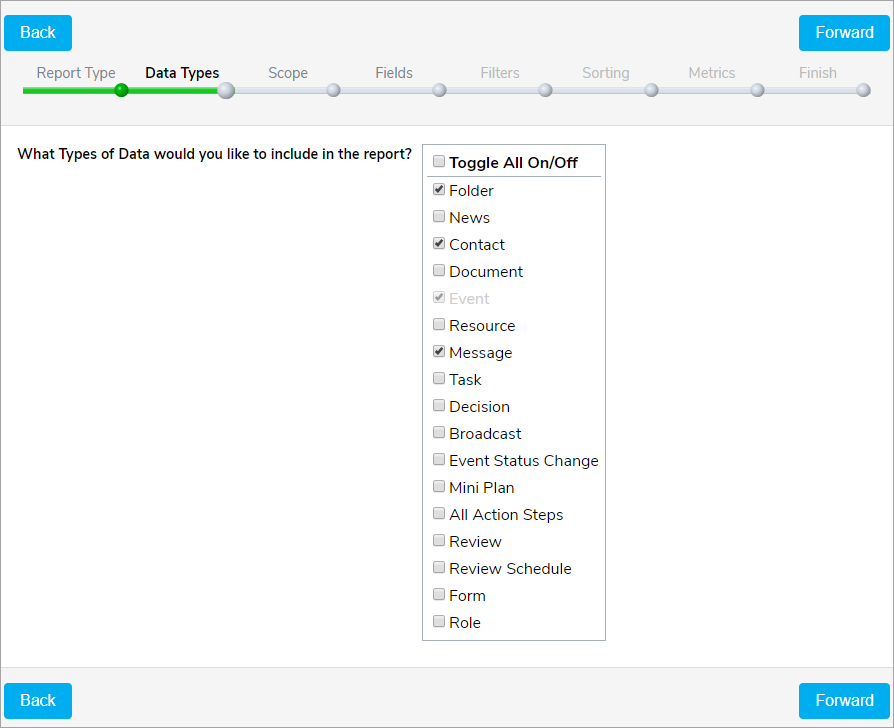
Scope
Here is where I found these in my organization hierarchy. Depending upon the size of your organization and the complexity of your hierarchy, you may need to use the filter capability in order to search for specific data objects.
The scope of your report/query can determine how fast it runs, what is or isn’t included in the results and, most importantly, if you don’t see the organization and/or data object you want, chances are that your RPO doesn’t allow you to see them.
Fields
Each GAL data type has different fields that are available for the report. The user’s RPO determines which fields they can include in their report. Any custom fields that are associated with each GAL data type are also available if you have the authorization.
You must select at least one field for each data type in order for the Forward button to be active. I have selected one field for each data type that we included in this report. Even though you might not select a field for inclusion in the report/query, it can still be used to filter, sort, and group your results.
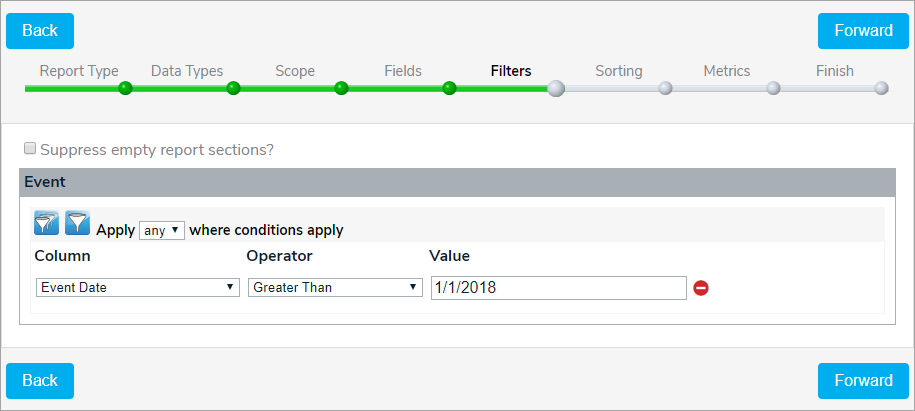
Filters
I only want to see the data from records after January 1, 2018, so I have set up a filter like this:
You can set up a filter for each data object that you have selected, but you do not have to create a filter for each data object or create filters at all. Filters also allow you to specify grouping within each data type. For example, I could add this filter to my report: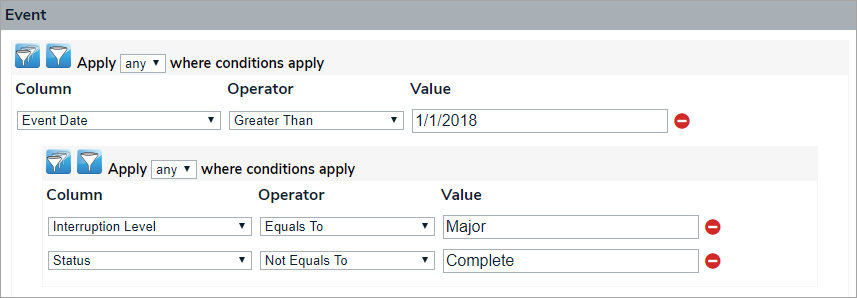
Now, only data from events that occurred after January 1, 2018 with an interruption level of Major or a of status Not Complete will be in the report.
Filters give you a lot of flexibility to select exactly what data to include/exclude but take some time to understand how ALL and ANY work for your report. When you use filters on multiple data objects it can get complicated and you may end up with no data for a specific data object or, for that matter, the entire report may be blank.
Sort
The data you have selected can be sorted by any field associated with each data object. You can also order the fields within each data object in order to sequence how the fields are listed across the page of your report. You can change the field label names in each section as well. I can set up multiple sort fields but, remember, it is determining how to sort the data within each data type section. My report will have 4 sections: Folder, Contact, Event, and Message and that order cannot be changed.
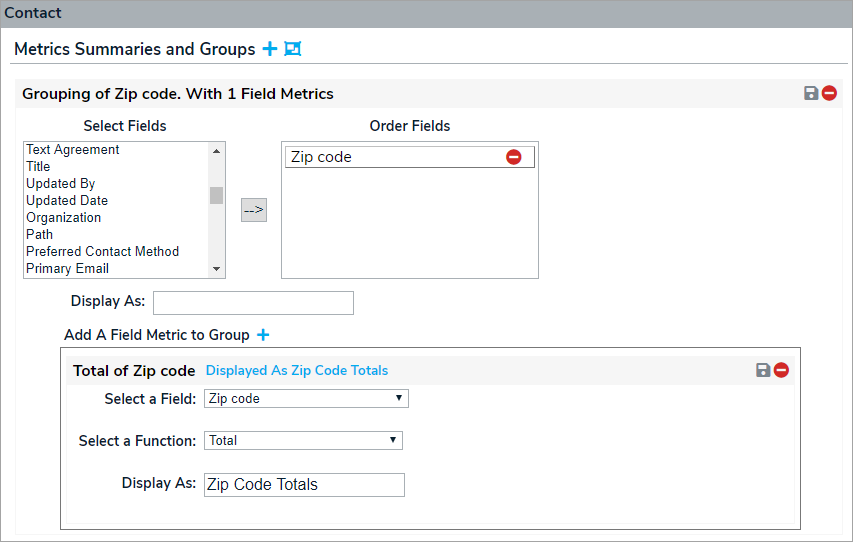
Metrics
The final part of your report/query allows you to create summaries for each data type and create groups within each data type. For example, I could group all of the contacts in my report by zip code.
In addition, I could get a count by zip code of the contacts involved in the events that I have selected.
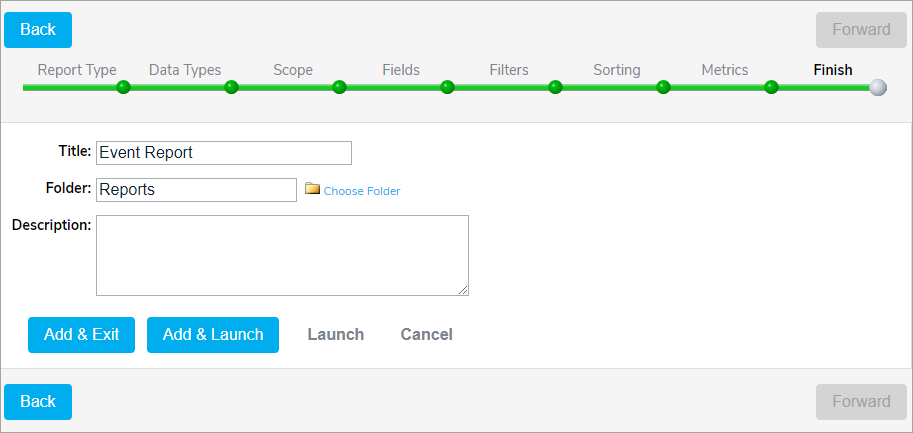
Finish
The last task prior to saving your report/query is to give it a title, description and tell GAL which folder the report will be saved in. The report is displayed on the screen and allows the user to display it in HTML, CSV, TXT or XML format. If the report needs to be edited after launching, click the Back button to return to the wizard.