
Before creating a new report, ensure pop-up blockers are turned off in your browser.
- To create a new report, click Reports in the navigation bar, then click Add to display the Report Wizard.
- Select a report focus, then report type. There are different types of reports available for each focus area. Listing reports are primarily used to retrieve information to print or download. Custom Form Query reports are primarily used to pull information into a form or plan-event editor.
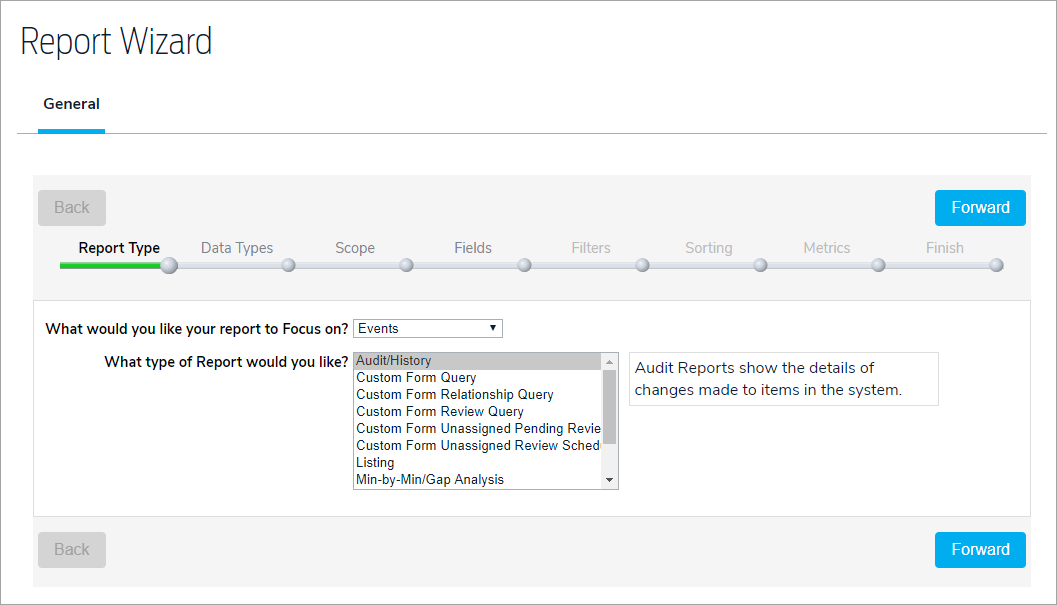
- Click Forward to move to the Data Types step.
- Select the data type(s) you wish to include in the report. Multiple data types will appear in their own sections in the report.
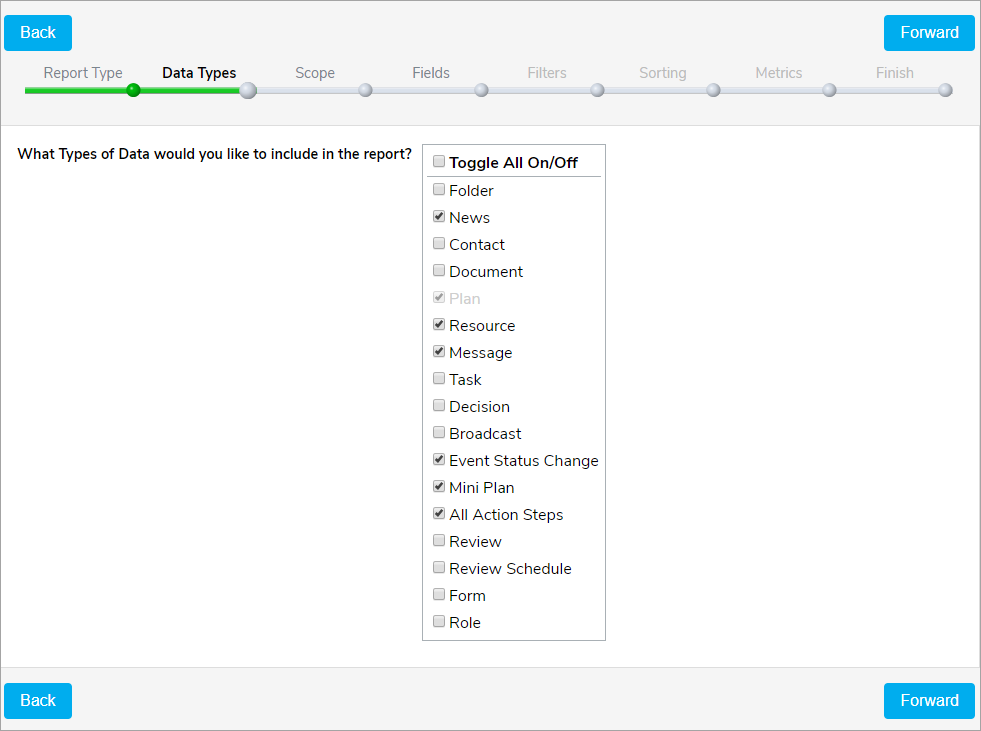
- Click Forward to move to the Scope step.
- Make a selection in the Current Relative Location section to either include or exclude the current organization and all its sub-folders.
- In the Include Options pane, navigate to the items you wish to include or exclude from the report, then click Include or Exclude.
Note: Excluding a large amount of data can affect the report's performance. As such, depending on the report, it may be better to select the orgs you wish to include, rather than exclude items on large reports.
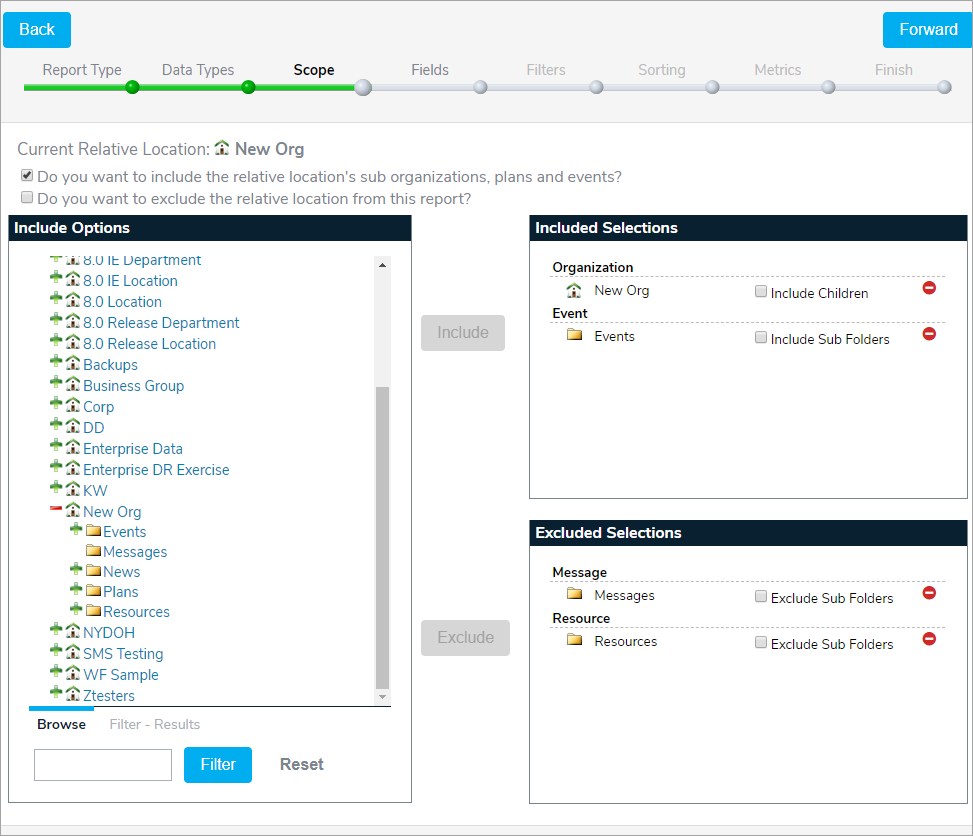
- Click Forward to move to the Fields step.
- Select at least one field for each data type to include in the report. The fields that appear in this step depend on the current user's roles and permissions. Note that fields that are not added to the report/query can still be used to filter, sort, and group the results.
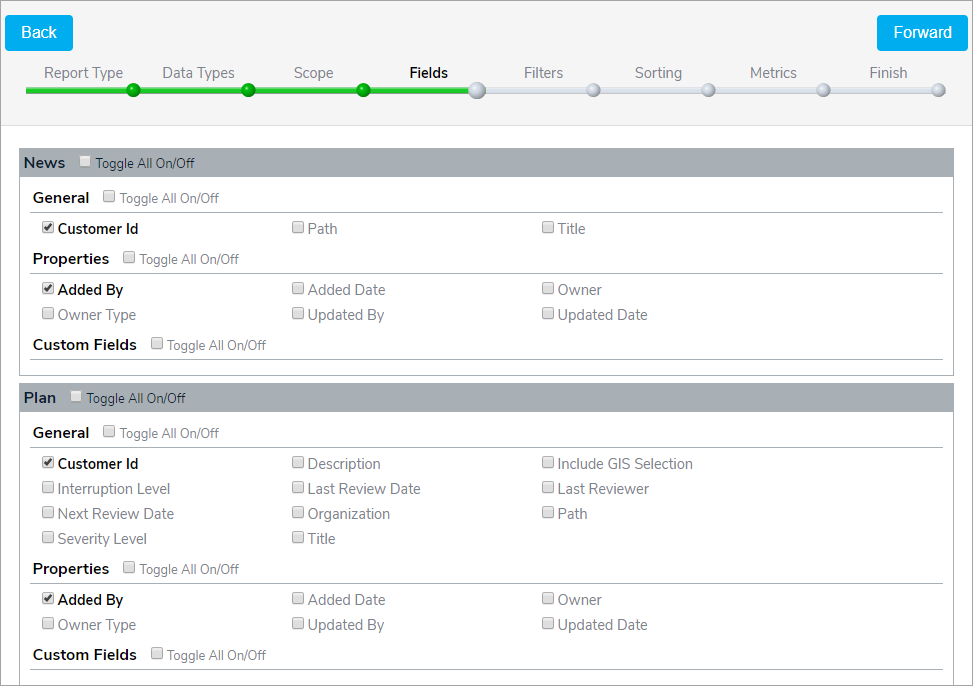
- Click Forward to move to the Filters step to add filters to the data types. If this button is grayed out, ensure a field has been selected for each data type included in the report.
- Select All from the Apply where conditions apply dropdown menu to ensure the generated data meets all the conditions in the filter. Select Any to ensure the generated data meets at least one condition.
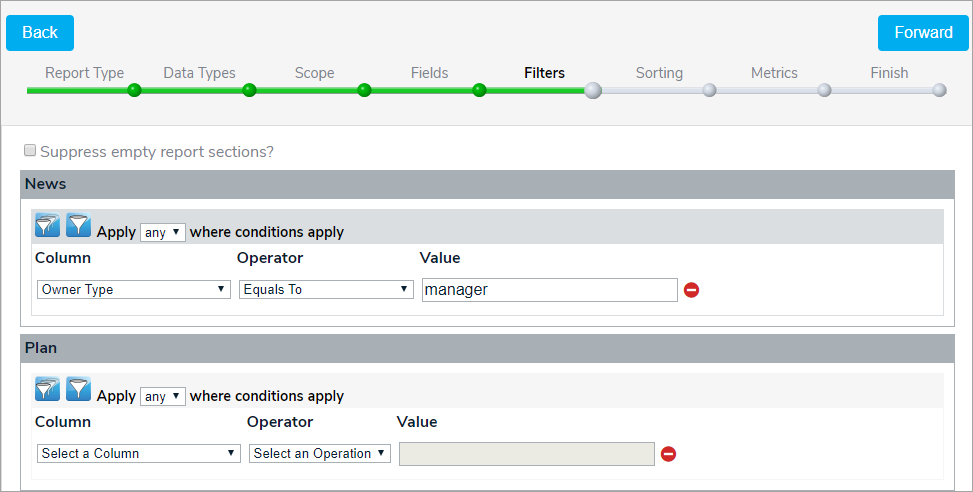
- Select a column, operator, and value of the condition.
- Click the
 icon to add a new filter for the data type. Click the
  icon to add a new filter group.
 - Click Forward to move to the Sorting step.
- Select one or more fields associated with a data type to sort by that field.
- Click and drag a field to configure the fields' order on the report. To change the label of the field, click the pencil icon.
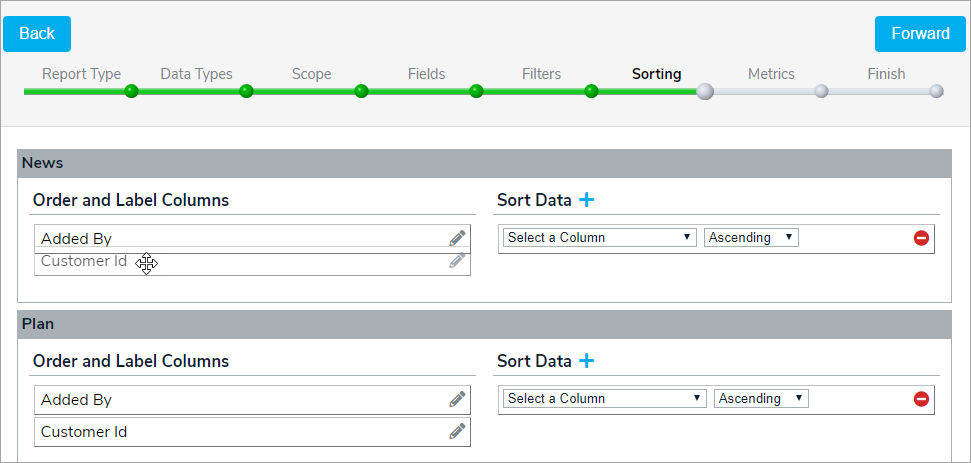
- In the Sort Data section, select Ascending or Descending to choose how the fields are sorted. Click the
 icon to add another sorting condition.
 - Click Forward to move to the Metrics step.
- Click the or
 icons to create summaries for the data types or create groups within each data type. For example, you could group the events by Event Date and calculate the Average Due By Minutes for each action step in those events.
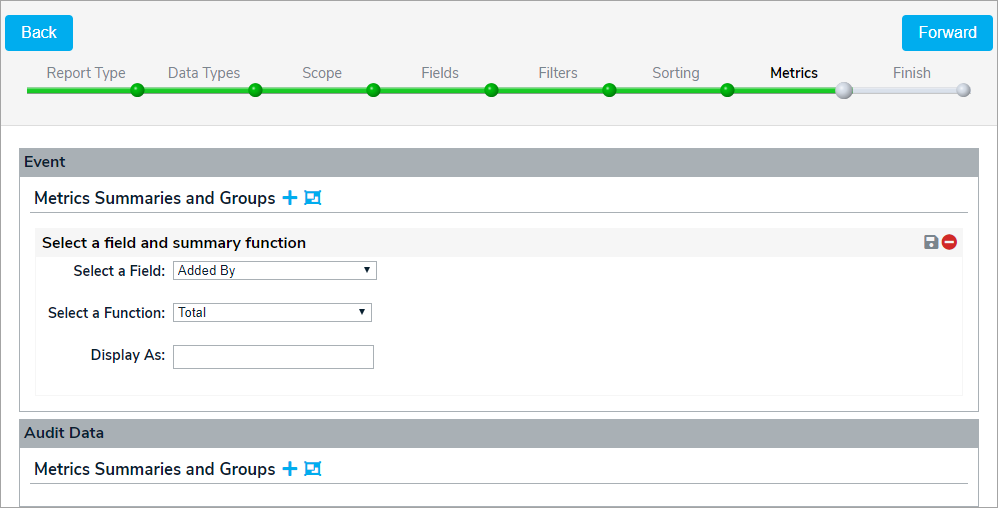
- Click Forward to move to the Finish step.
- Enter a name for the report, select a new folder (if needed), and enter any descriptions. Click Add & Launch to save your report and launch it.


 icon to add a new filter for the data type. Click the
  icon to add a new filter group.
 icon to add another sorting condition.
 icons to create summaries for the data types or create groups within each data type. For example, you could group the events by Event Date and calculate the Average Due By Minutes for each action step in those events.
The launched report will appear in a separate window in which you can select the output type: HTML, CSV, TXT or XML. You can copy the data into a document or spreadsheet depending upon your requirements.
When displaying a report, it is given a URL similar to this one: http://192.168.1.110:7092/Reports/ DisplayResults.aspx?ID=135824&TYPE=HTML
To format the report for a printer, copy the URL into another browser window and change it to http://192.168.1.110:7092/Reports/ ShowReport .aspx?ID=135824&TYPE=HTML

